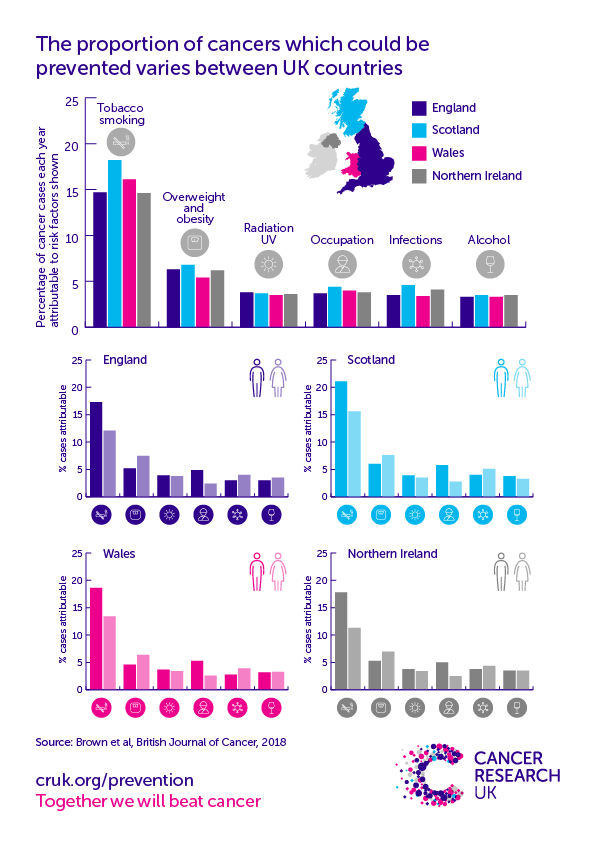
Around 4 in 10 UK cancer cases every year could be prevented (2015).[1]
Variation by sex and country is generally only a few percentage points, so these differences should be interpreted cautiously.
All Cancers Excluding Non-Melanoma Skin Cancer (C00-C96 Excl. C44), Number of Preventable Cases and Percentage of Total Cases Which Are Preventable, UK, 2015
| England | Scotland | Wales | Northern Ireland | UK | ||
| Males | Preventable cases | 58,141 | 6,567 | 3,838 | 1,856 | 70,425 |
| Preventable percentage | 38.0% | 43.3% | 39.0% | 39.9% | 38.6% | |
| Females | Preventable cases | 53,480 | 6,455 | 3,373 | 1,663 | 65,130 |
| Preventable percentage | 36,4% | 39.7% | 36.5% | 36.1% | 36.8% | |
| Persons | Preventable cases | 111,722 | 13,038 | 7,207 | 3,519 | 135,507 |
| Preventable percentage | 37.3% | 41.5% | 37.8% | 38.0% | 37.7% |
The proportion of cases which are preventable is slightly higher for males than for females. This is mainly because risk factor exposure (e.g. smoking prevalence) is generally higher in males than females. The higher risk factor exposure in males outweighs the larger number of sex-specific cancer types and risk factors in females.
The proportion of cases which are preventable is slightly higher in Scotland than in the other UK nations. This is mainly because risk factor exposure is generally higher in Scotland than the other UK nations. Variation in risk factor exposure by country reflects data quality and demographic differences. For example, deprivation is associated with smoking, and with susceptibility to environmental/societal factors such as food pricing and availability.[2,3]
Download this infographic in A4 for print, or in landscape format for presentations.
See also
Want to generate bespoke preventable cancers stats statements? Download our interactive statement generator. Note this uses 2015 figures and is not compatible with our 2023 smoking figures.
More information about our methodology for risk factor evidence
References
- Brown KF, Rumgay H, Dunlop C, et al. The fraction of cancer attributable to known risk factors in England, Wales, Scotland, Northern Ireland, and the UK overall in 2015. British Journal of Cancer 2018.
- Office for National Statistics. Adult smoking habits in the UK: 2015. Accessed October 2017.
- McGill R, et al. Are interventions to promote healthy eating equally effective for all? Systematic review of socioeconomic inequalities in impact. BMC Public Health 2015: 15, 457
About this data
Data is for: UK, 2015, ICD-10 C00-C97 excl. C44.


